Analyze their 9.5-hour stay, target the organic search goldmine,
and conquer the /analytics/web/ maze to boost engagement and conversions!
2. Global Reach Unleashed:
Dominate US & Indian traffic, refine your content for these
top performers, and watch your website reach new heights across the world!
3. Tech-Savvy Tweaks:
Master Chrome dominance and device preferences,
equip your website to deliver a seamless experience across platforms,
and capture every visitor's attention.
Description
BigQuery and Tableau
Unlocking Website Secrets: A Data-Driven Deep Dive into Your Google Analytics
Ever wondered what visitors do on your website? Where do they come from?
What makes them stay (or bounce)? My fourth portfolio project, powered by BigQuery and Tableau,
takes you on a thrilling data-driven adventure to answer these questions and more.
Unmask visitor behavior:
Discover the average time users spend on your site (a surprising 9.5 hours!),
identify bounce rates (305!), and understand their browsing patterns to optimize content and engagement.
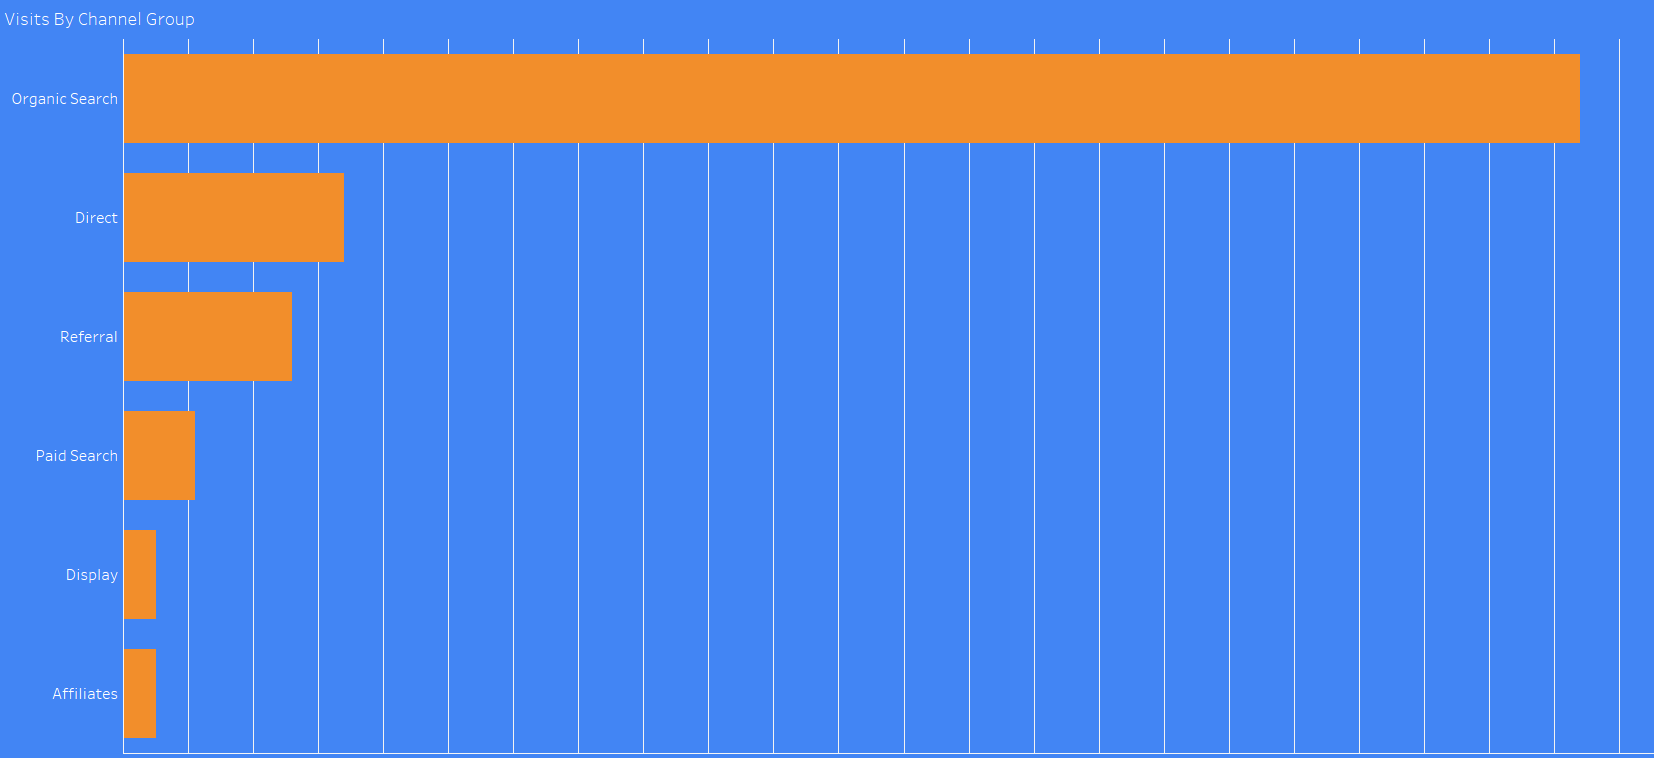
Target the right traffic:
Learn which channels drive the most visits (organic search is king!) and new users
(organic search again!), allowing you to focus your marketing efforts where they yield the most results.
Master the referral maze:
Explore the top paths visitors take to reach your site (/analytics/web/), helping you
refine your internal linking strategy and improve user experience.
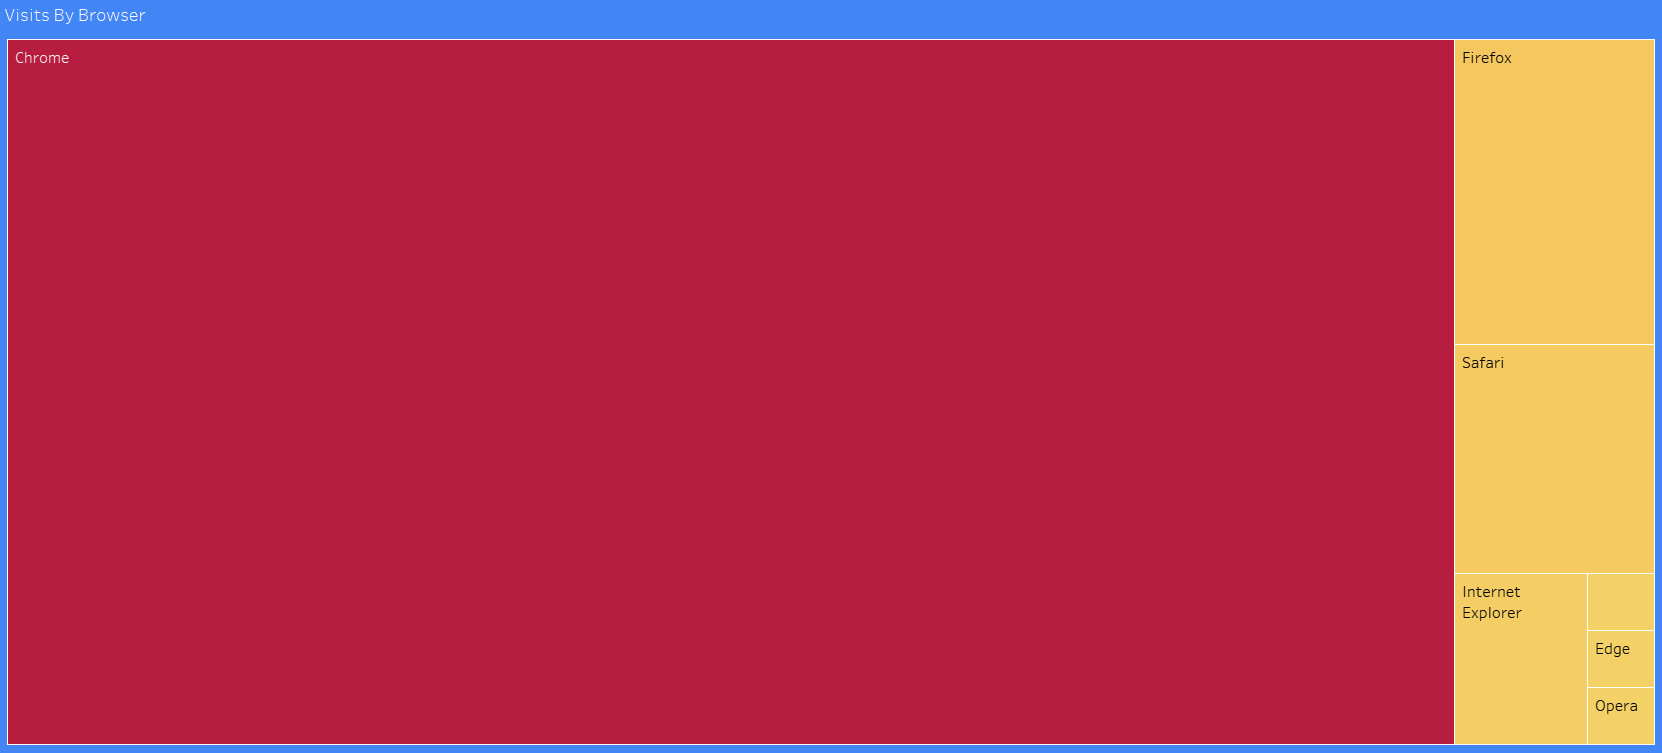
Tech trends revealed:
Analyze the dominant browsers (Chrome reigns supreme) and devices your audience uses,
ensuring your website delivers a seamless experience across platforms.
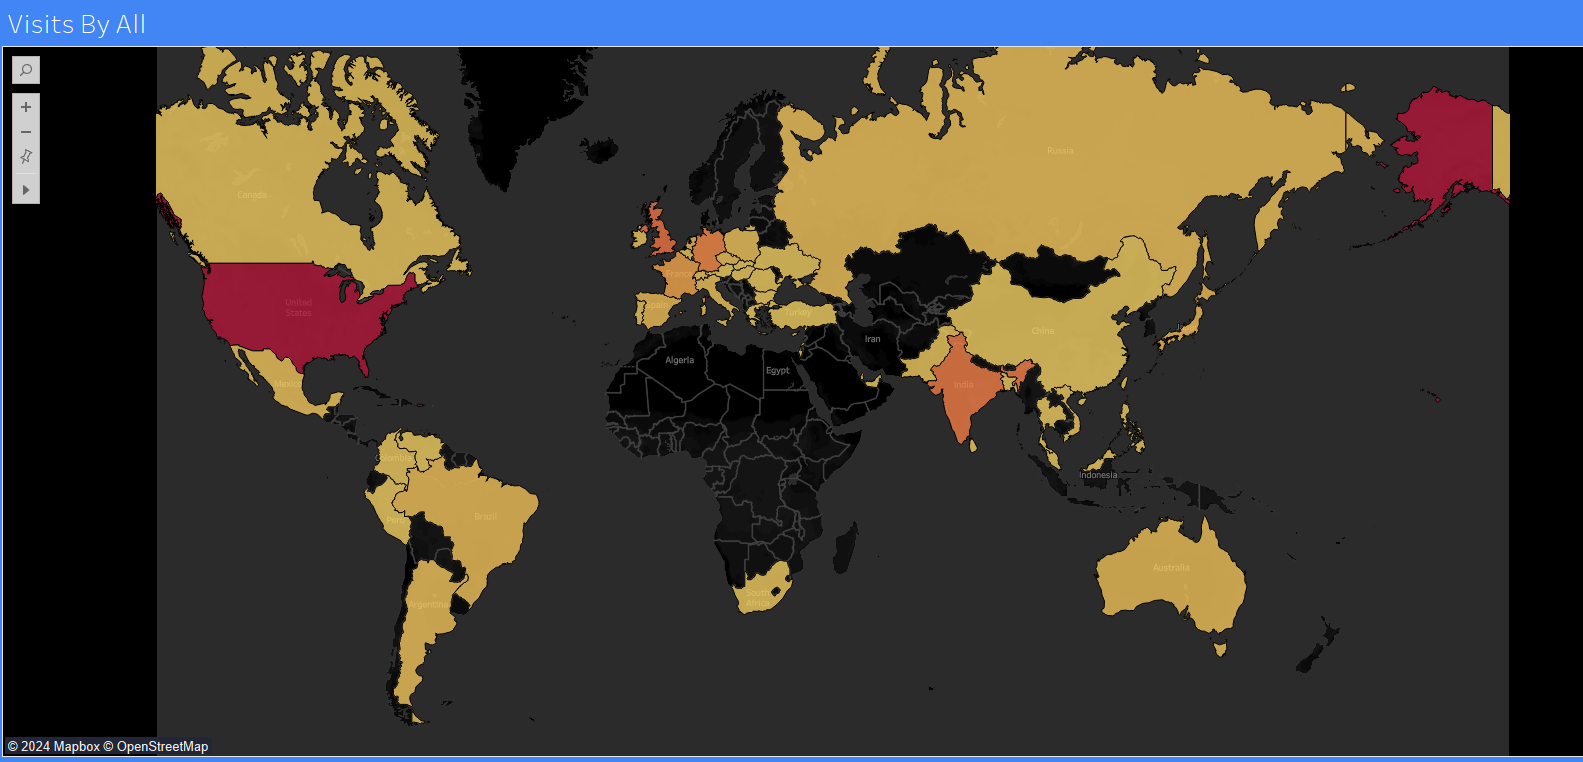
Global reach unlocked:
Identify the countries providing the most traffic (the US and India take the lead!),
empowering you to tailor content and outreach for international audiences.
And that's just the tip of the iceberg! My project delivers interactive visualizations (cards, treemaps, bar charts, and more!) to bring the data to life and guide your decision-making.
Don't leave your website's success to chance! Dive into the data with me, unlock valuable insights, and watch your online presence soar.
Remember, data is knowledge. Knowledge is power. Let's harness that power together!
Why did I create this?
BigQuery and Tableau
1. Unraveling the Secrets of Website Traffic: Why I Analyzed Google Analytics
My "Data Analysis on Google Analytics website" project wasn't just a portfolio
piece but a deep dive into the fascinating world of online behavior. As a data analyst, I'm obsessed with understanding
user journeys and optimizing experiences, and what better platform to explore than the ubiquitous Google Analytics?
2. Beyond the Basics, Unveiling Hidden Insights:
I craved a project that went beyond the typical website analysis. Analyzing minute-by-minute engagement, referral path intricacies,
and global traffic patterns allowed me to uncover unique insights and showcase my ability to delve deeper than surface-level metrics.
3. Sharpening My Toolkit, Empowering Others:
Understanding website traffic dynamics isn't just about personal growth; it's about equipping myself to provide actionable
insights to businesses and individuals seeking to optimize their online presence. By analyzing user engagement, top sources, and
regional trends, I hope to empower others to make data-driven decisions.
4. Staying Relevant, Future-Proofing My Career:
Mastering Google Analytics is a must-have skill for any data analyst. This project allowed me to hone my expertise in this crucial tool,
solidifying my understanding of user behavior and trends, and making me more valuable and prepared for future opportunities.
5. My Analysis Questions:
My specific questions showcase a keen understanding of website traffic dynamics. Analyzing engagement metrics, referral sources,
channel performance, and international reach paints a holistic picture of user journeys and website effectiveness.
Data-Analysis Result
BigQuery and Tableau
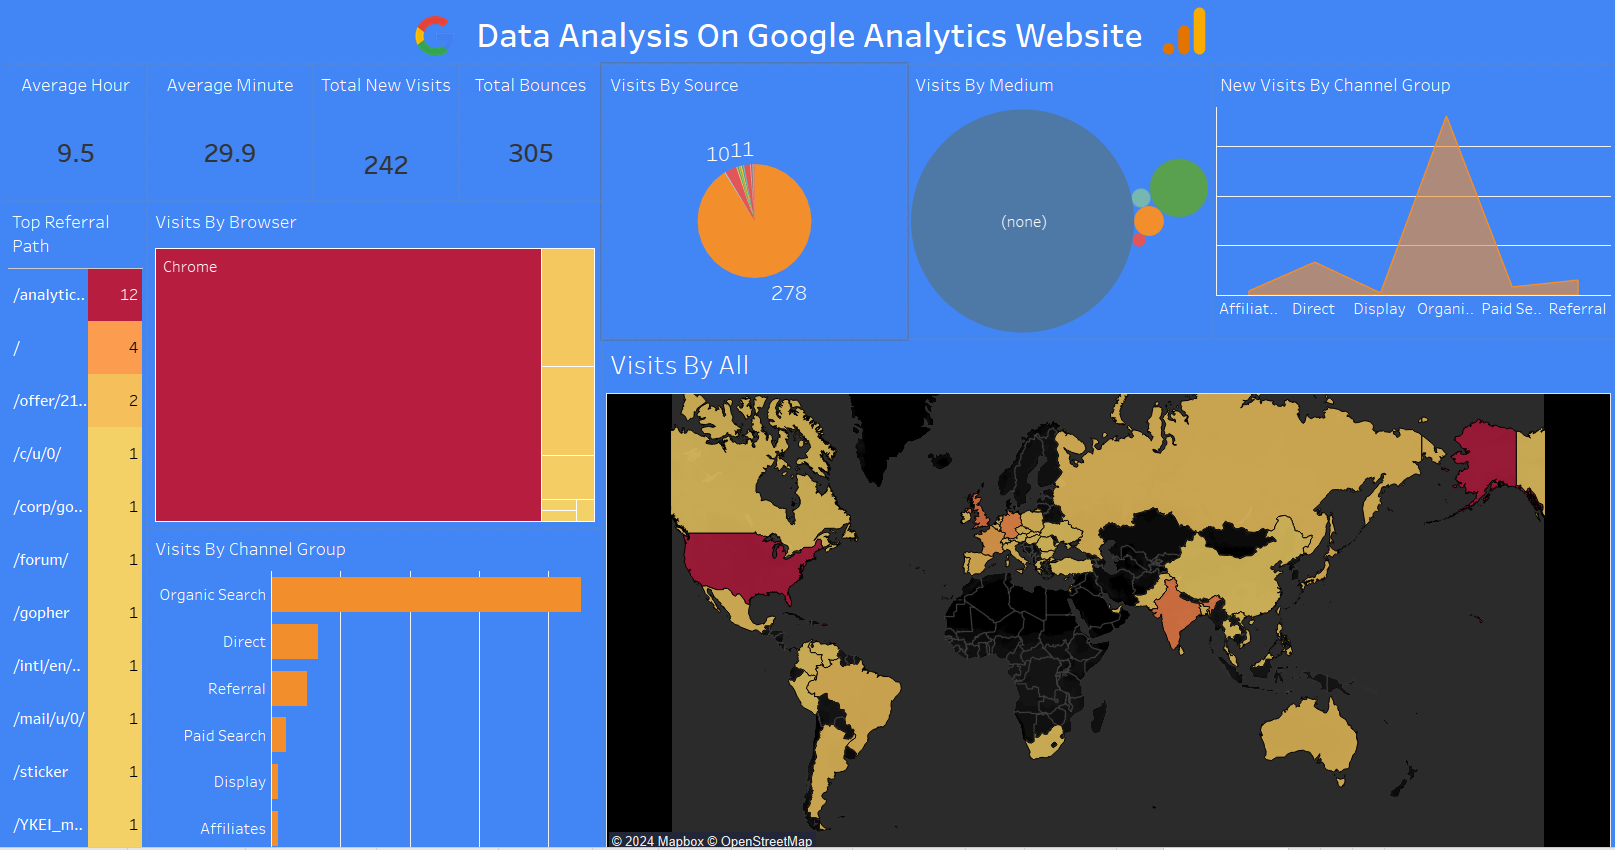
Data Analysis On Google Analytics Website Dashboard
Dashboard
Average hour of a Google Analytics website is 9.5.
Average minute of a Google Analytics website is 29.9.
The total new visits on a Google Analytics website is 242.
The total bounces on a Google Analytics website is 305.
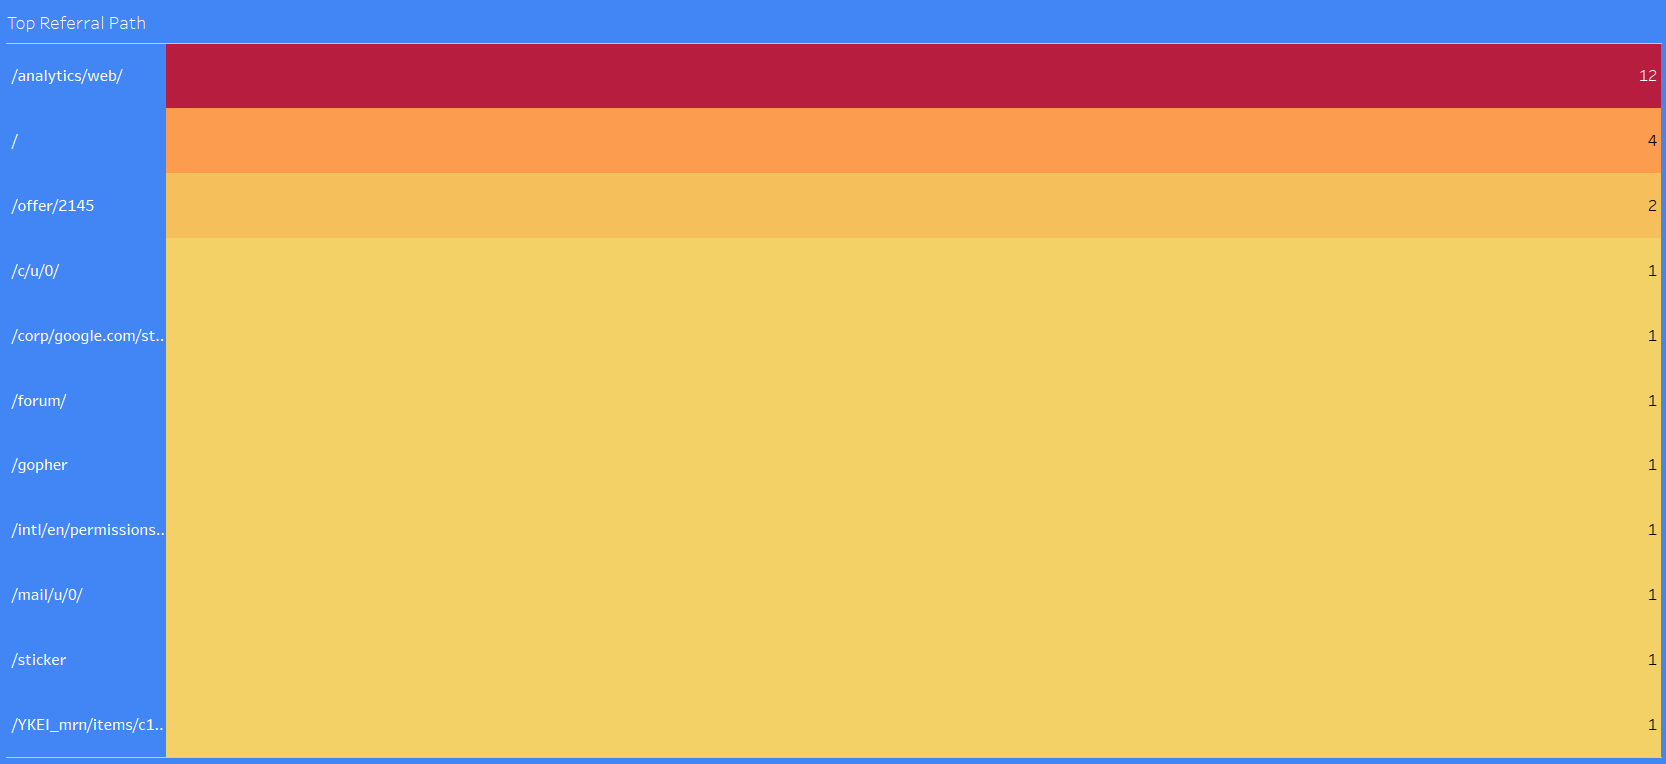
/analytics/web/ are the top referral paths for the website with the help of a bar chart.
Chrome browser provides the highest number of visits to the website with the help of a treemap.
The organic Search channel group provides the highest number of visits to the website with the help of a horizontal bar graph.
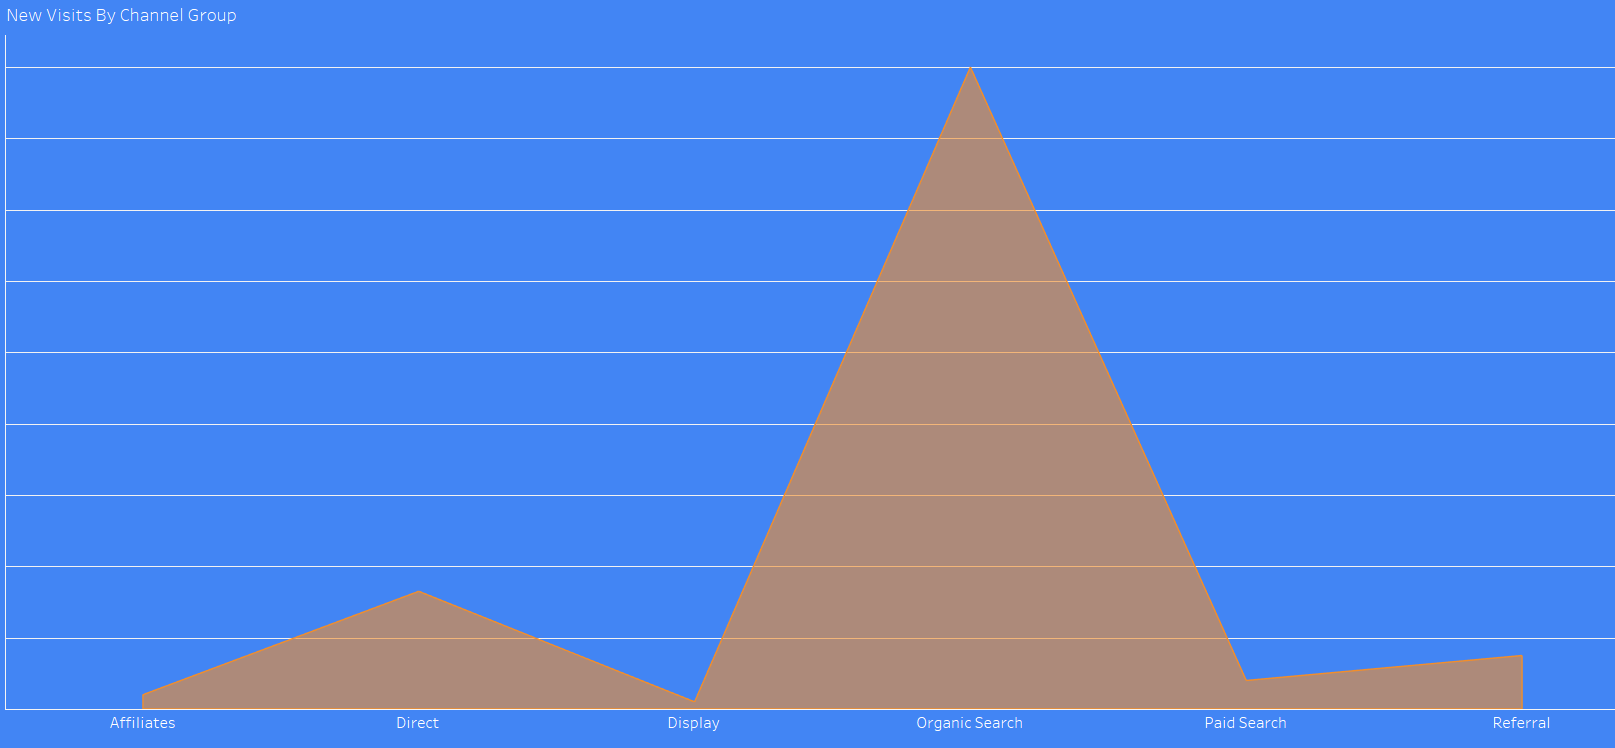
The organic Search channel group provides the highest number of new visits to the website with the help of an area chart.
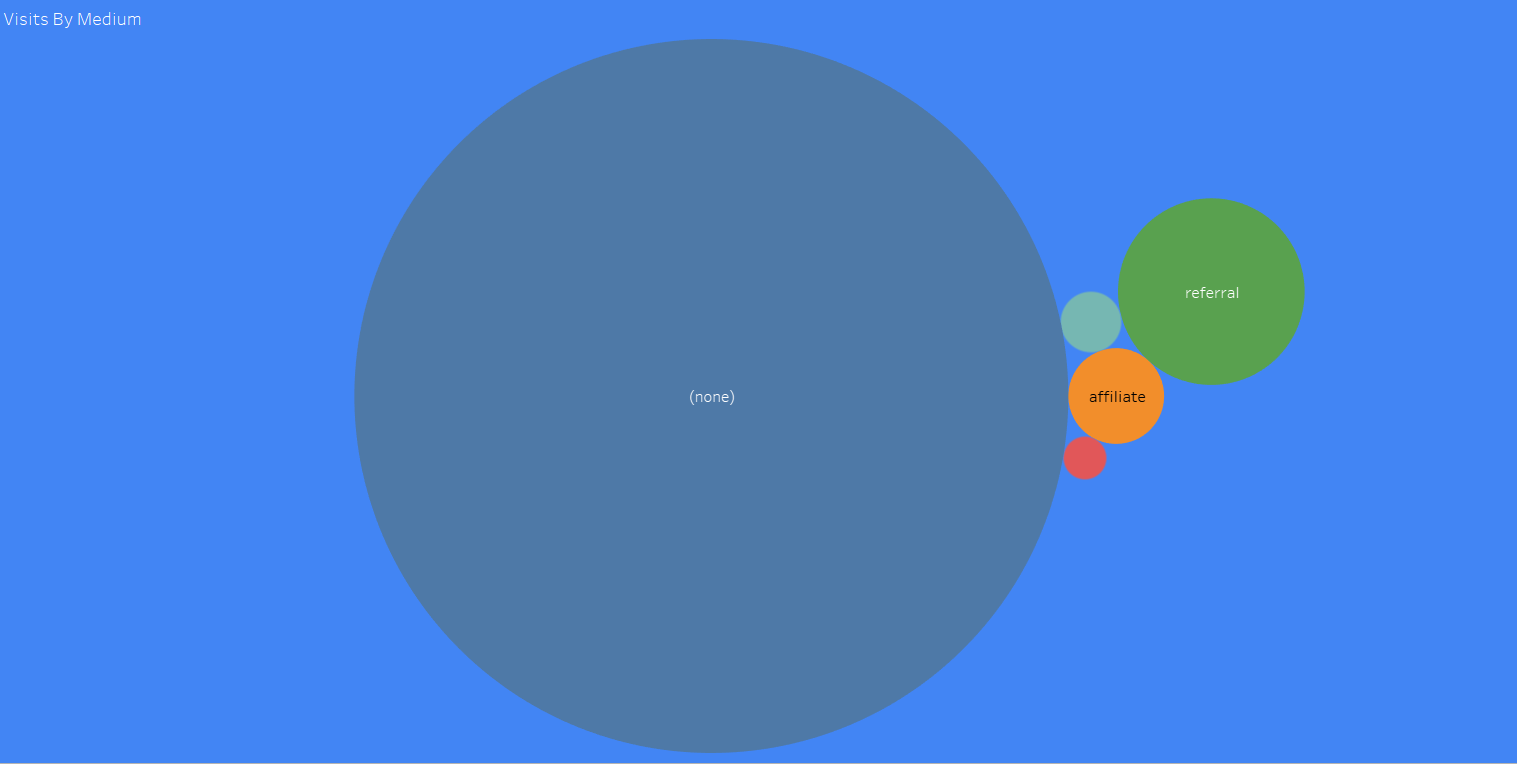
None medium provides the highest number of visits to the website scatter graph.
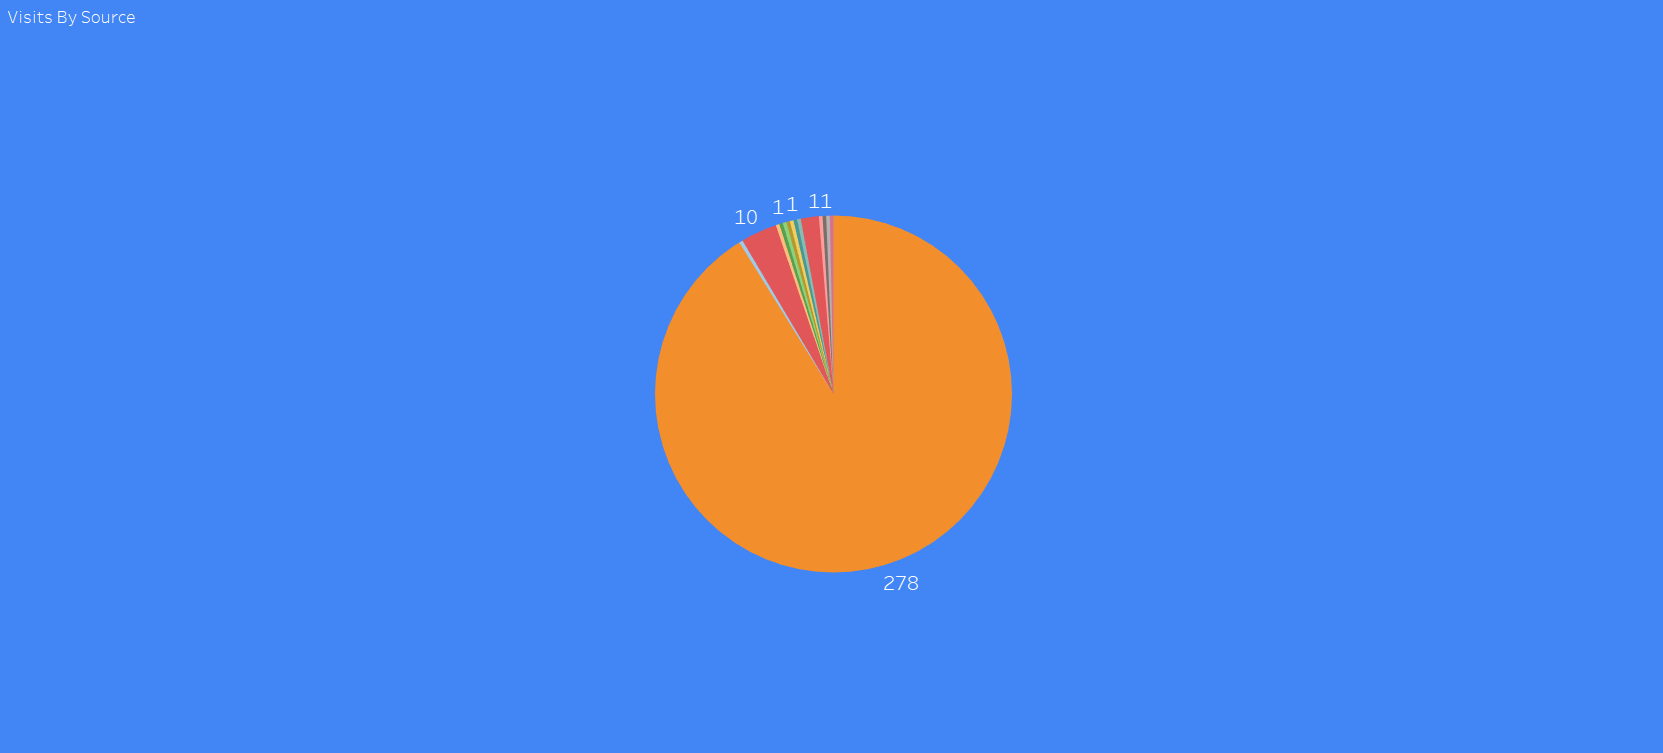
Direct source provides the highest number of visits to the website with the help of a pie chart.
The United States and India have the highest number of visits to the website with the help of a map chart.